Sampling Locations
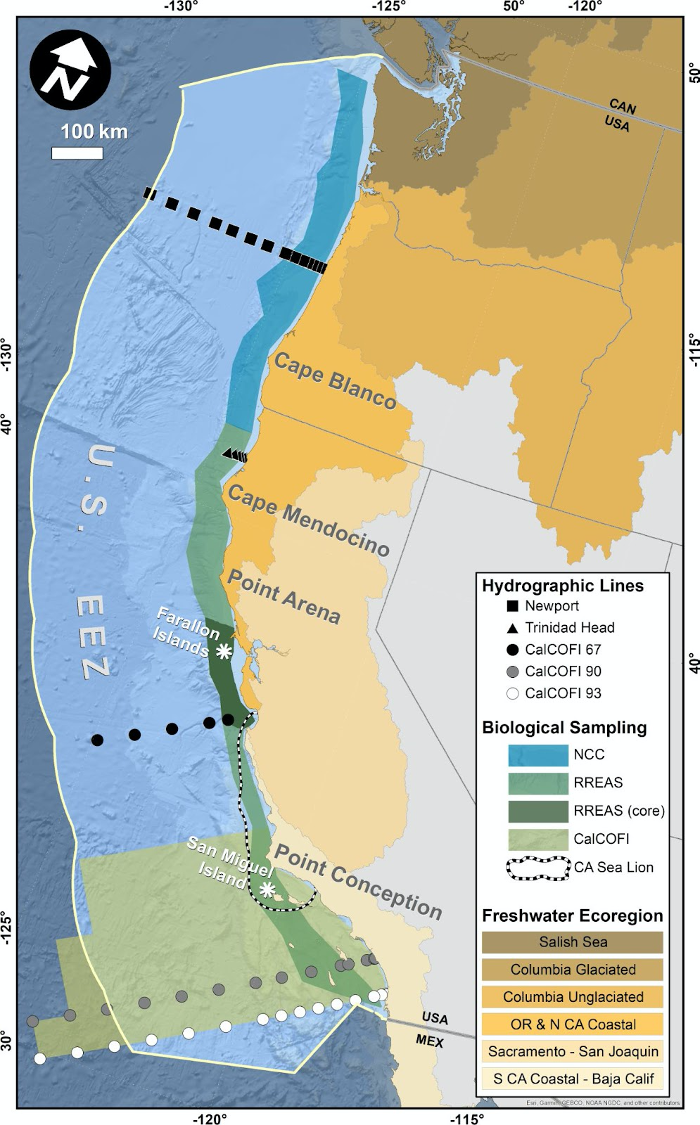
We generally refer to areas north of Cape Mendocino as the “Northern CCE,” Cape Mendocino to Point Conception as the “Central CCE”, and south of Point Conception as the “Southern CCE.” Figure 1 shows sampling areas for most regional oceanographic data. Key oceanographic transects are the Newport Line off Oregon, the Trinidad Head Line off northern California, and CalCOFI lines further south, while shaded marine regions indicate sampling areas for most biological surveys. This sampling is complemented by basin-scale oceanographic observations and by outputs from various models. Figure 1 also shows sampling areas for most biological indicators. The shaded terrestrial areas in Figure 1 represent freshwater ecoregions in the CCE, and are the basis by which we summarize indicators for snowpack, flows, and stream temperatures.